
Example electron microprobe analysis (EM-PA)
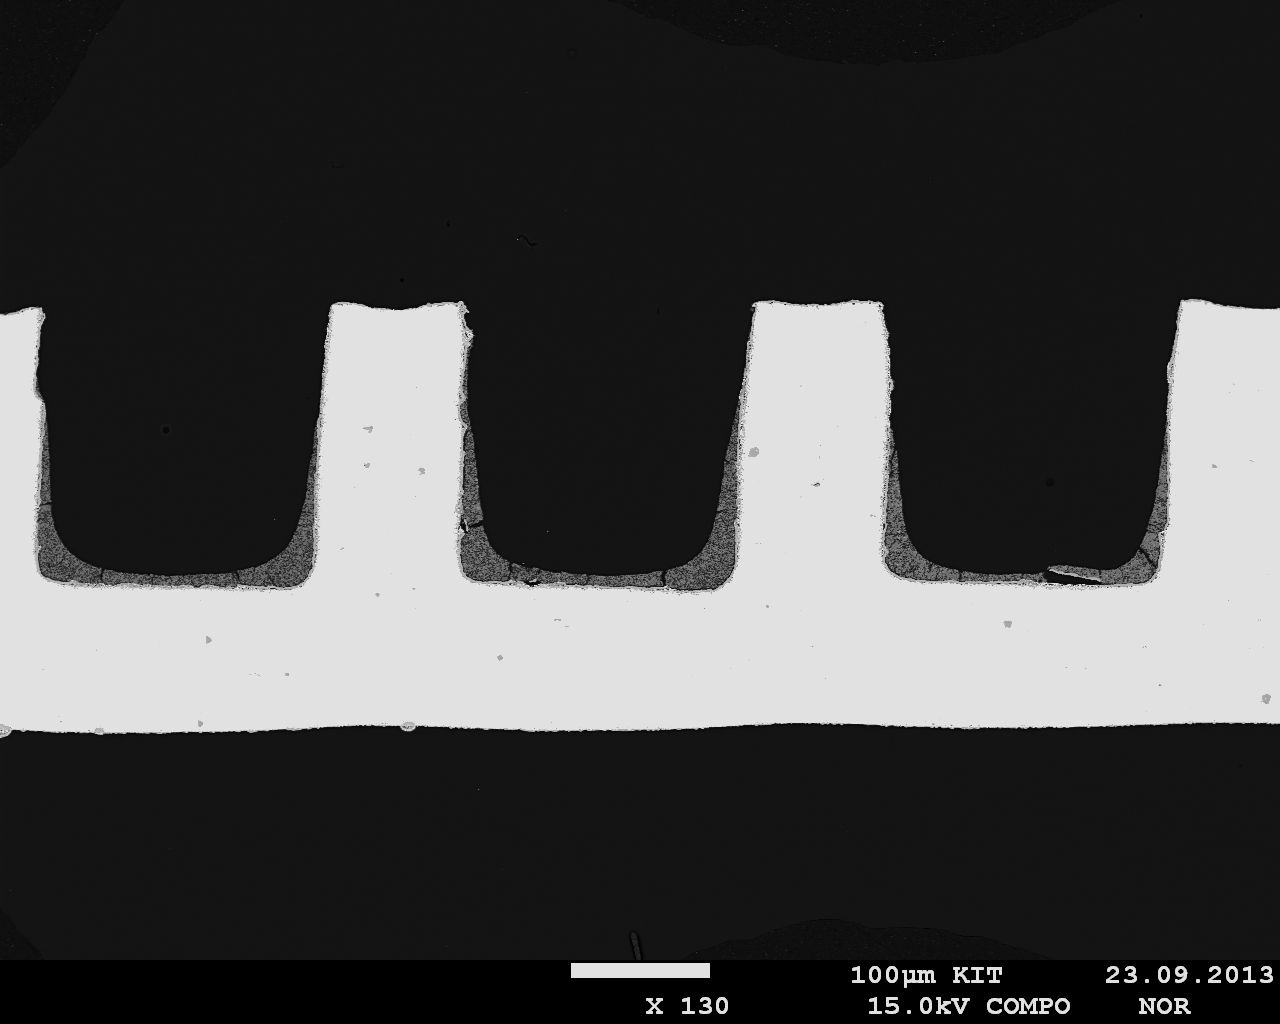
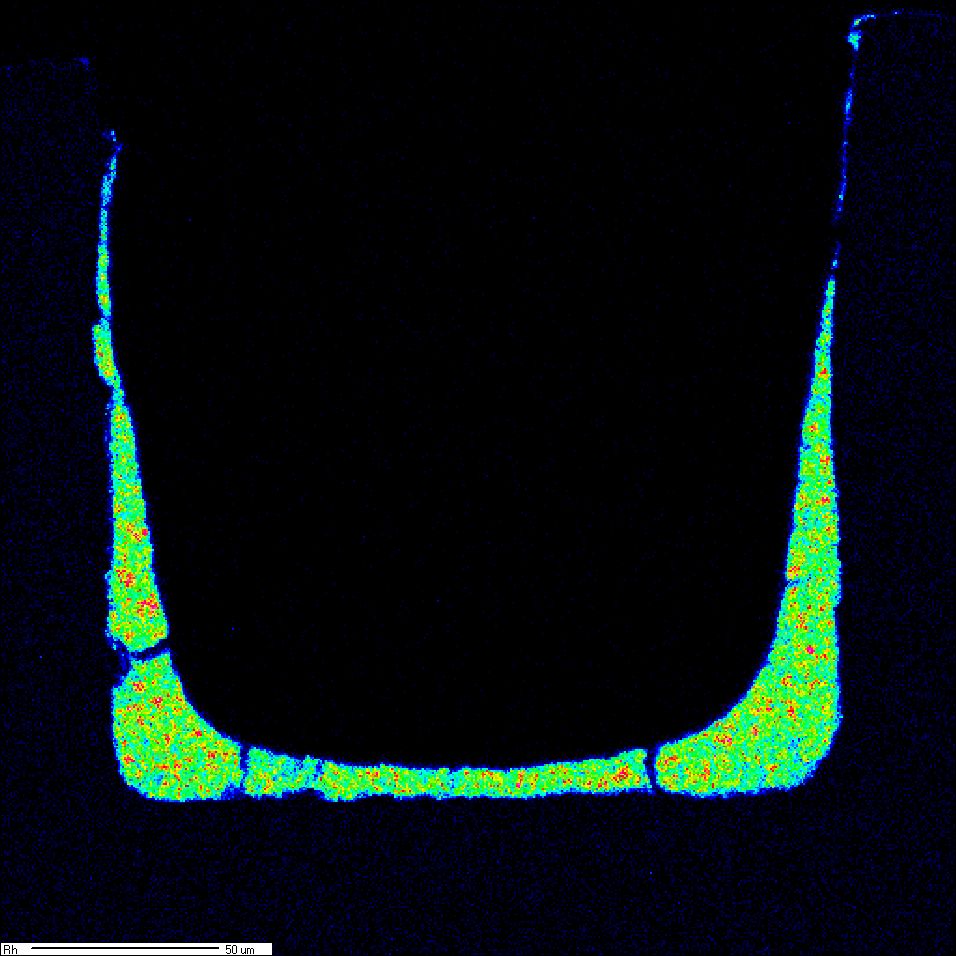
Fig. 1: Left: Transverse section of a microstructured sheet. Right: Rh distribution in the microchannel (copyright: IMVT).
Fig. 1 shows on the left side a cross-section of a microstructured sheet coated with a Rh/Al2O3 catalyst. The image on the right side shows the Rh map inside a channel taken with the microprobe. A homogeneous distribution of Rh in the Al2O3 can be seen.
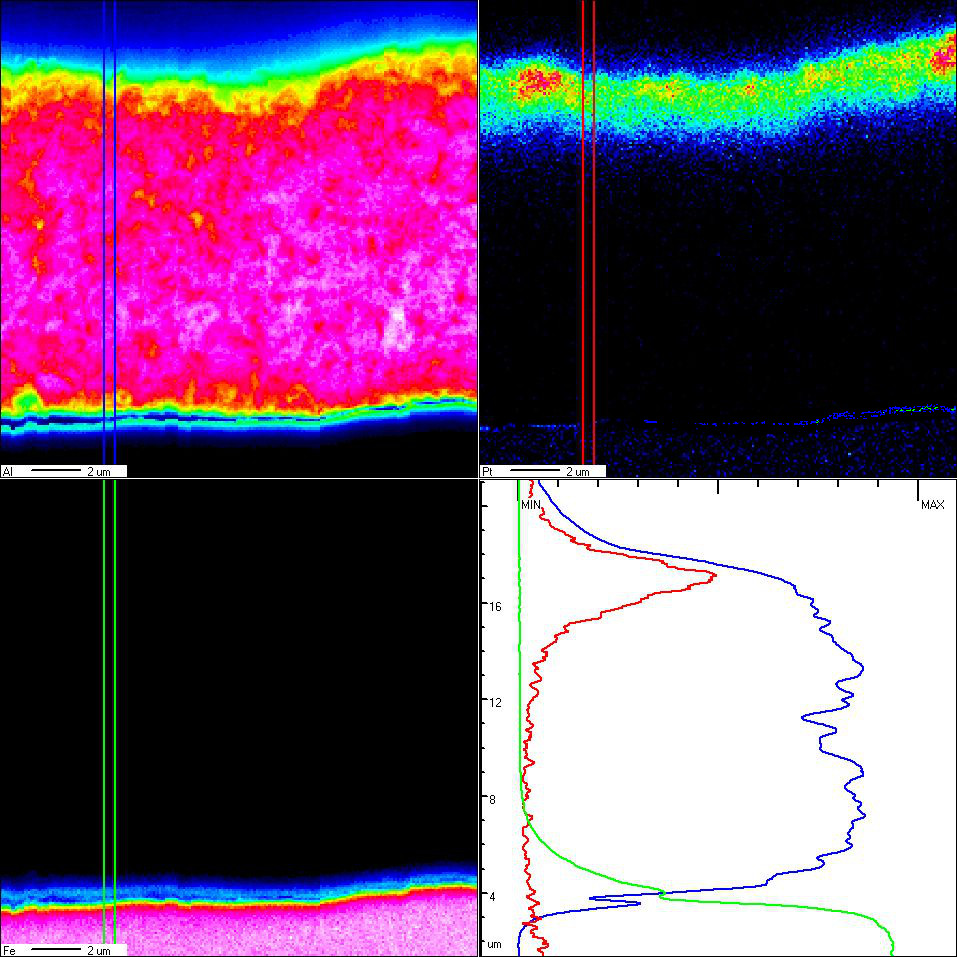
Fig. 2 also shows the result of a map on a microstructured sheet. Here, the channels were coated with Pt / Al2O3. In the result, one can already see in the element distribution that the Pt has ac-cumulated on the surface of the coating. The qualitative linescan further clarifies the result (red line: Pt; blue line: Al; green line: Fe). The Pt content in the maximum was determined by quan-titative analysis and amounts to 0.43 wt-%.